
티스토리 뷰
스프링 부트로 프로젝트를 만들고 나면, 서버가 잘 돌아가는지 확인하고 싶어진다.
그래서 Actuator를 확인하면 암호같아보이는 Json 텍스트만 가득하고,
내가 찾고 싶은 정보를 이 복잡한 정보 더미에서 찾기란 쉽지가 않다
그래서 프로메테우스와 그라파나를 이용해서 시각적으로 보기 편한 대시보드를 만들어보자
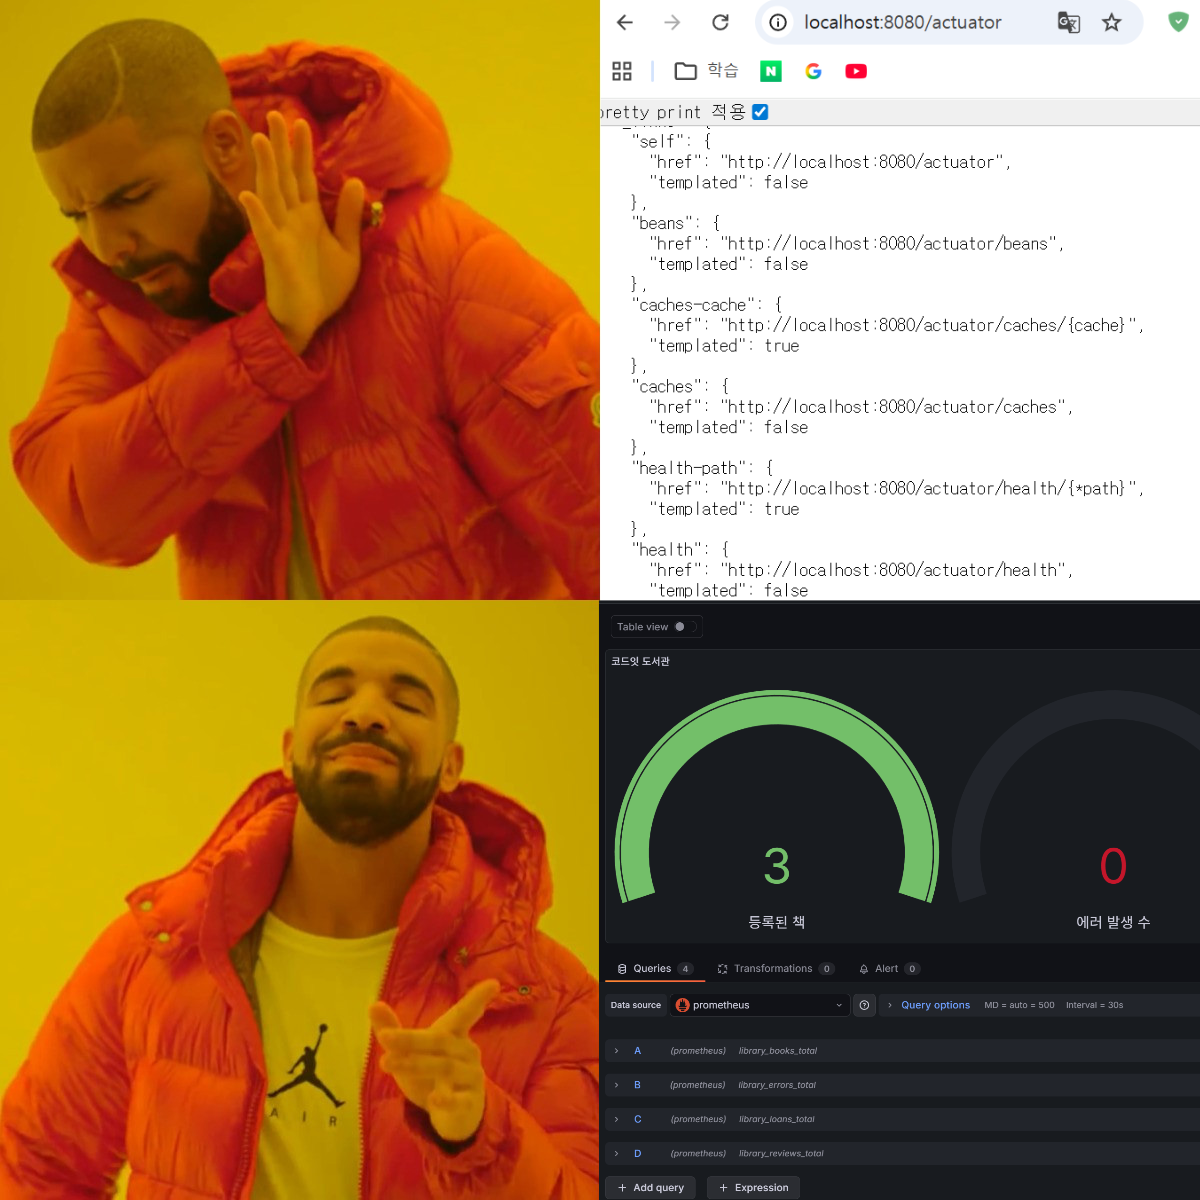
지루하고 현학적임.
단계적으로 따라 해보자! (Window 기준)
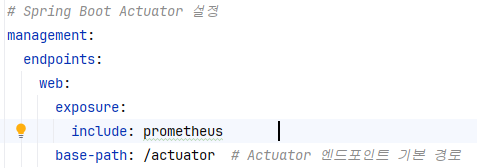
1. 스프링 부트 설정하기

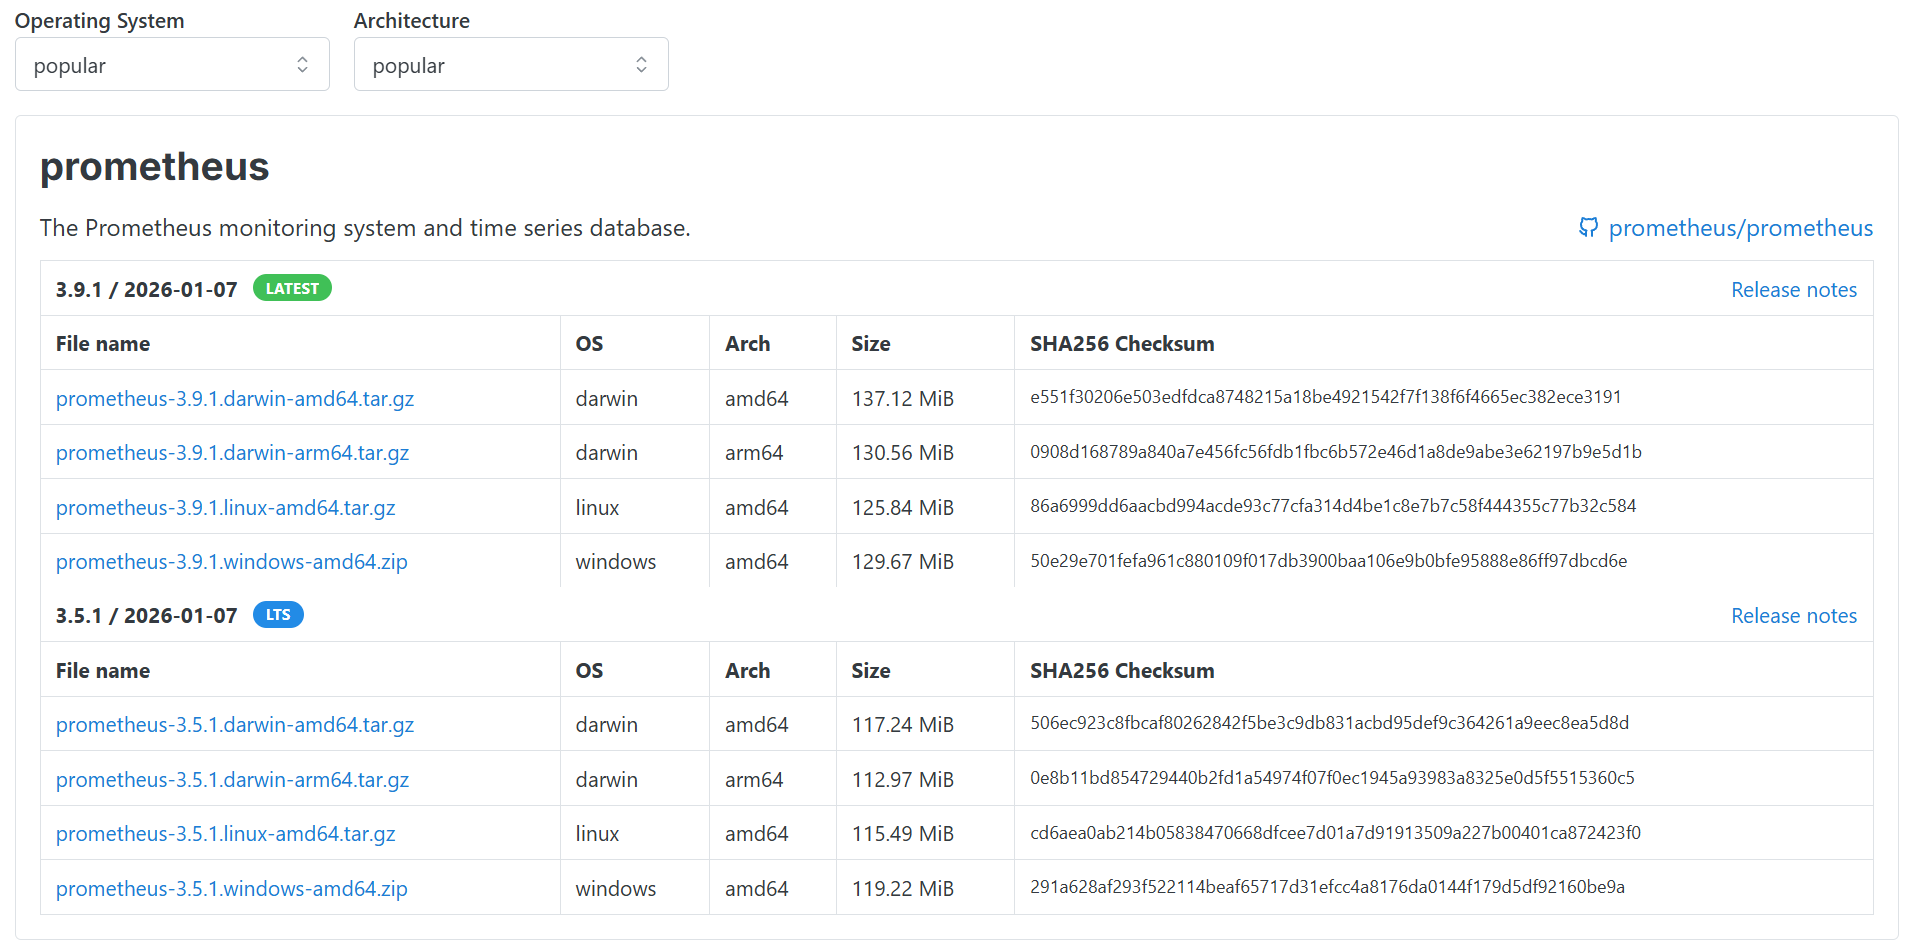
2. 프로메테우스 다운받기
https://prometheus.io/download/
Download | Prometheus
Downloads for the latest releases of the Prometheus monitoring system and its major ecosystem components.
prometheus.io

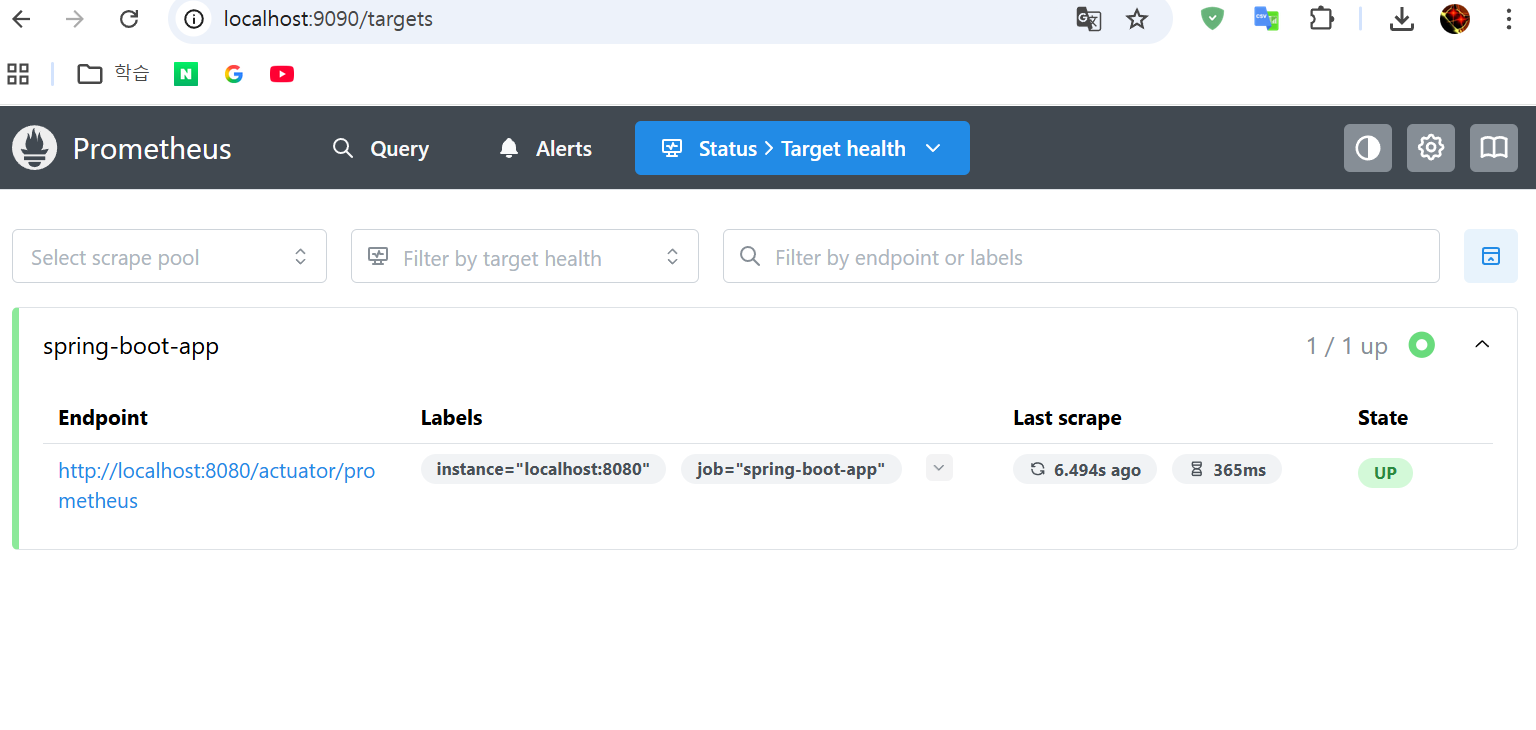
scrape_configs:
  - job_name: "spring-boot-app"
    metrics_path: '/actuator/prometheus'
    static_configs:
      - targets: ["localhost:8080"]
3. 그라파나 다운받기
https://grafana.com/grafana/download?platform=windows
Download Grafana | Grafana Labs
Overview of how to download and install different versions of Grafana on different operating systems.
grafana.com
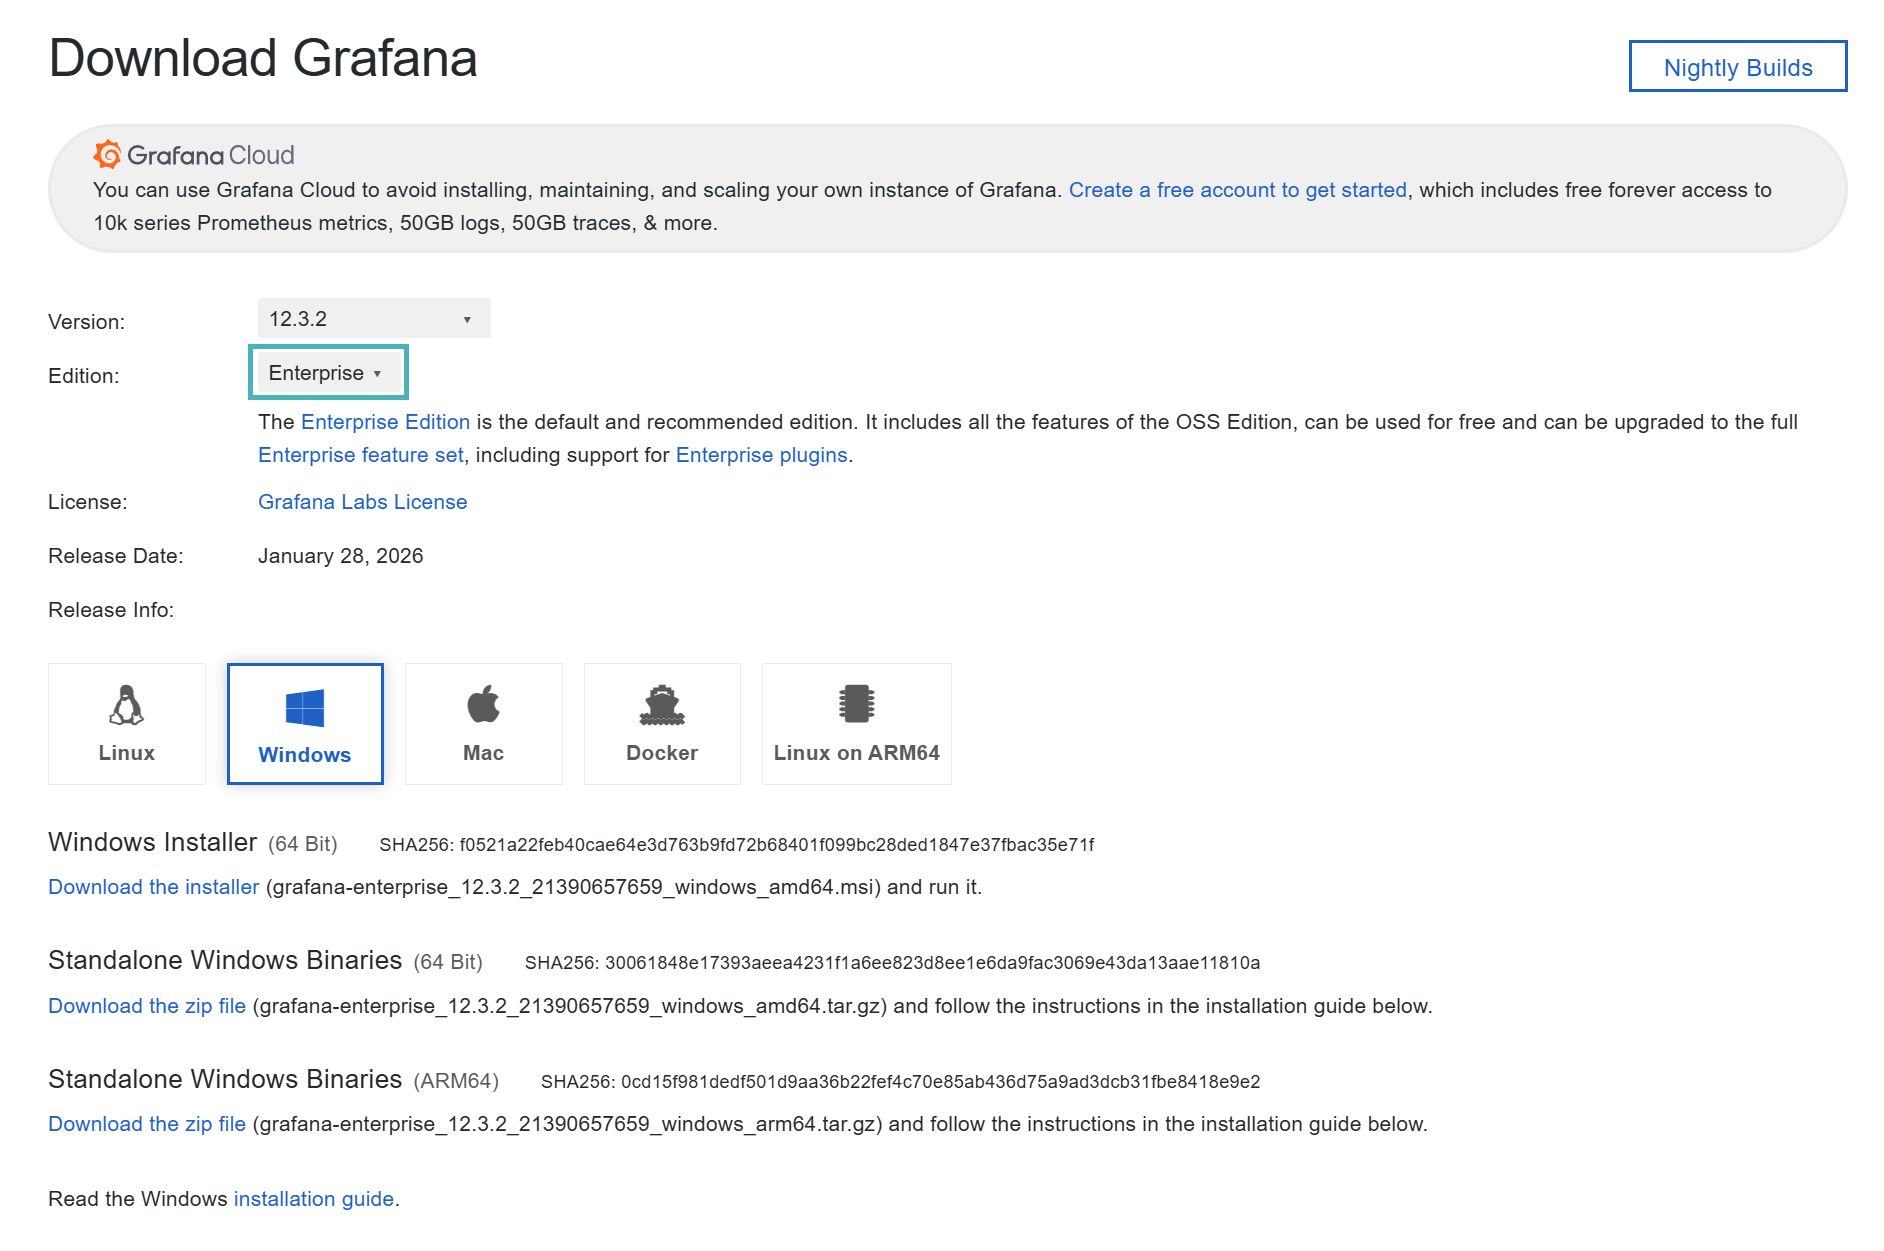
그라파나는 디폴트가 엔터프라이즈로 되어있는데 꼭 OSS(오픈 소스 소프트웨어)로 다운 받자
4. 프로메테우스 실행하기

5. 연결 확인하기
6. Grafana 접속하기
http://localhost:3000
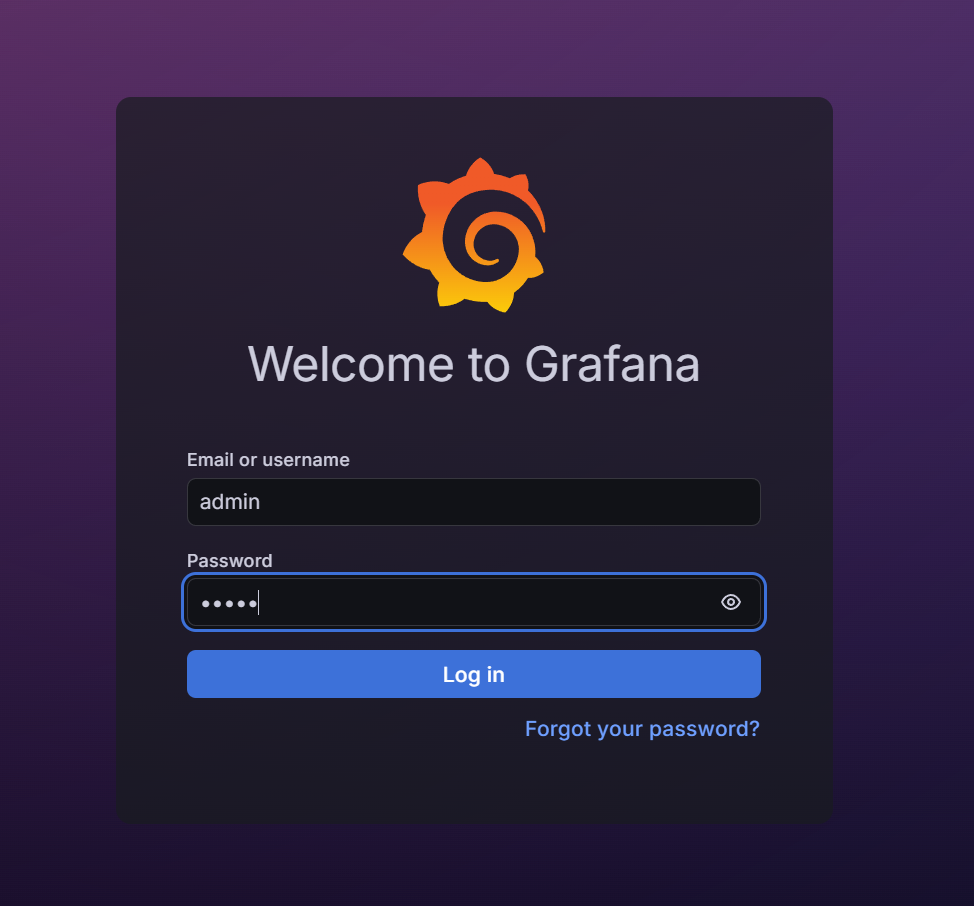
그라파나가 잘 설치됐다면 위의 링크로 들어가서 접속 해보자
ID Password 모두 디폴트 값인 'admin' 을 입력하면 잘 접속이 된다
7. 설정하기
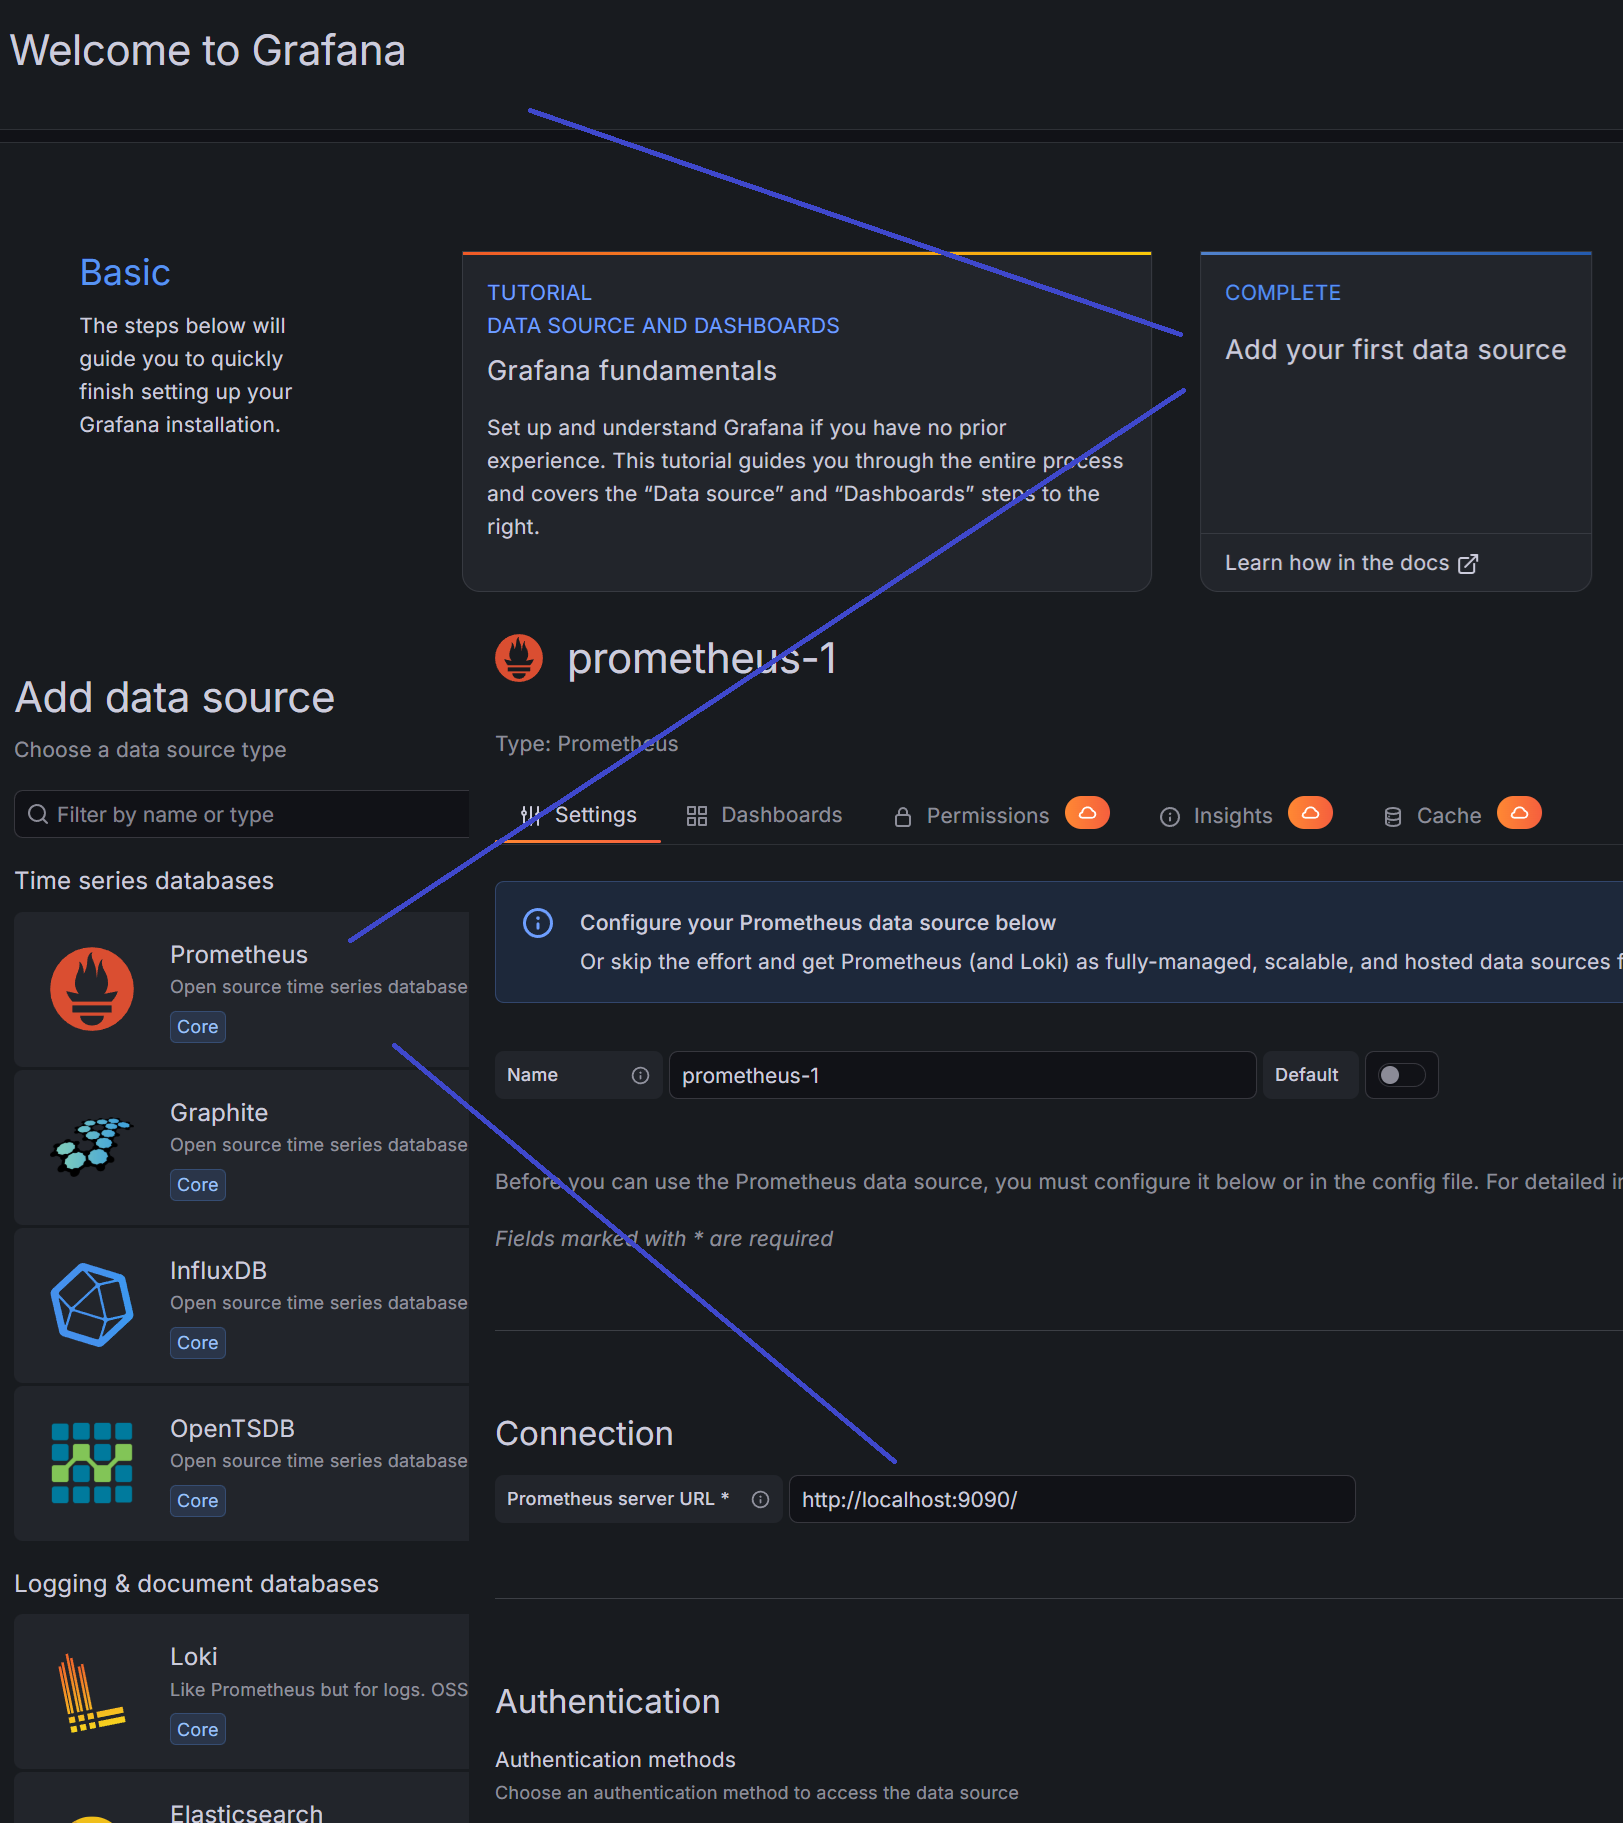


이제 select metric에 쿼리를 채우고, visualization에서 원하는 차트로 변경하면 된다.
8. 결과
